Restaurant Inventory Shrinkage: Track Waste Correctly
When restaurant inventory shrinkage rises, profit can fall before anyone notices a problem in the bank account. Spoiled produce, incorrect portions, unrecorded staff meals, receiving errors, and counting mistakes can all reduce the value of food on hand.
A useful system connects kitchen records with the general ledger. You need separate numbers for food cost percentage, COGS, waste cost, and unexplained shrinkage. Then use the same daily, weekly, and month-end process every period.
Separate the Four Numbers in Your Restaurant Books
These terms overlap, but they answer different questions. Keeping them separate gives owners and bookkeepers a clearer view of gross profit.
Food cost percentage and COGS
COGS , or cost of goods sold, measures the direct cost connected to the food sold during a period. A common inventory formula is:
Beginning inventory + purchases - ending inventory = COGS
For a restaurant, direct food costs may include ingredients, certain direct packaging costs, and freight-in when your accounting policy includes it. Rent, office costs, advertising, and administrative payroll are operating expenses instead.
Food cost percentage turns COGS into a sales comparison:
Food cost percentage = food COGS / food sales x 100
For example, food COGS of $43,500 against food sales of $120,000 produces a food cost percentage of 36.25%.
That percentage is useful for pricing and menu analysis. However, it doesn't identify why costs changed. A higher percentage could come from vendor price increases, large portions, waste, inaccurate recipes, or missing inventory.
The IRS explains inventory and COGS concepts in Publication 334 for small businesses. Your accountant should confirm which costs belong in COGS for your business and accounting method.
Waste cost and inventory shrinkage
Waste cost is the recorded cost of food discarded or made unusable. Spoiled lettuce, burned sauce, broken eggs, and expired dairy are common examples.
Use this formula for each waste entry:
Waste cost = quantity discarded x unit cost
Inventory shrinkage is the difference between what your records say should be available and what a physical count finds. Shrinkage may include waste that staff never logged, receiving mistakes, portion differences, unrecorded transfers, or theft. Theft is only one possible cause.
A restaurant may track normal waste inside food cost for financial reporting while showing waste as a separate management account. Another business may post certain adjustments to an inventory adjustment or waste expense account. Keep the policy consistent, then review it with your accountant.
A waste log explains a known reduction in inventory. Shrinkage measures a gap that still needs an explanation.
Build Records Staff Can Complete During Service
A perfect system that nobody uses won't improve your books. Keep the forms short enough for a line cook, shift leader, or manager to complete without stopping operations.
Use a simple waste log
Record waste as it happens, or at fixed points during each shift. The manager should review entries before the day closes.
Useful waste log fields include:
| Field | What to record |
|---|---|
| Date and time | When the waste occurred |
| Item | Ingredient or prepared food |
| Quantity and unit | Pounds, cases, portions, ounces, or units |
| Unit cost | Cost per recorded unit |
| Total cost | Quantity multiplied by unit cost |
| Reason | Spoilage, overproduction, quality issue, burn, breakage, or other cause |
| Station or shift | Where and when the loss occurred |
| Employee or manager initials | Who recorded or approved the entry |
| Recovery or disposal note | Donated, repurposed, discarded, or returned when applicable |
Use actual purchase costs when available. If an ingredient arrives in cases but staff record pounds, convert the case cost into a consistent per-pound cost.
For prepared foods, record the batch or recipe name and the number of portions discarded. That information can reveal overproduction even when the ingredients were used correctly.
Use consistent fields for inventory counts
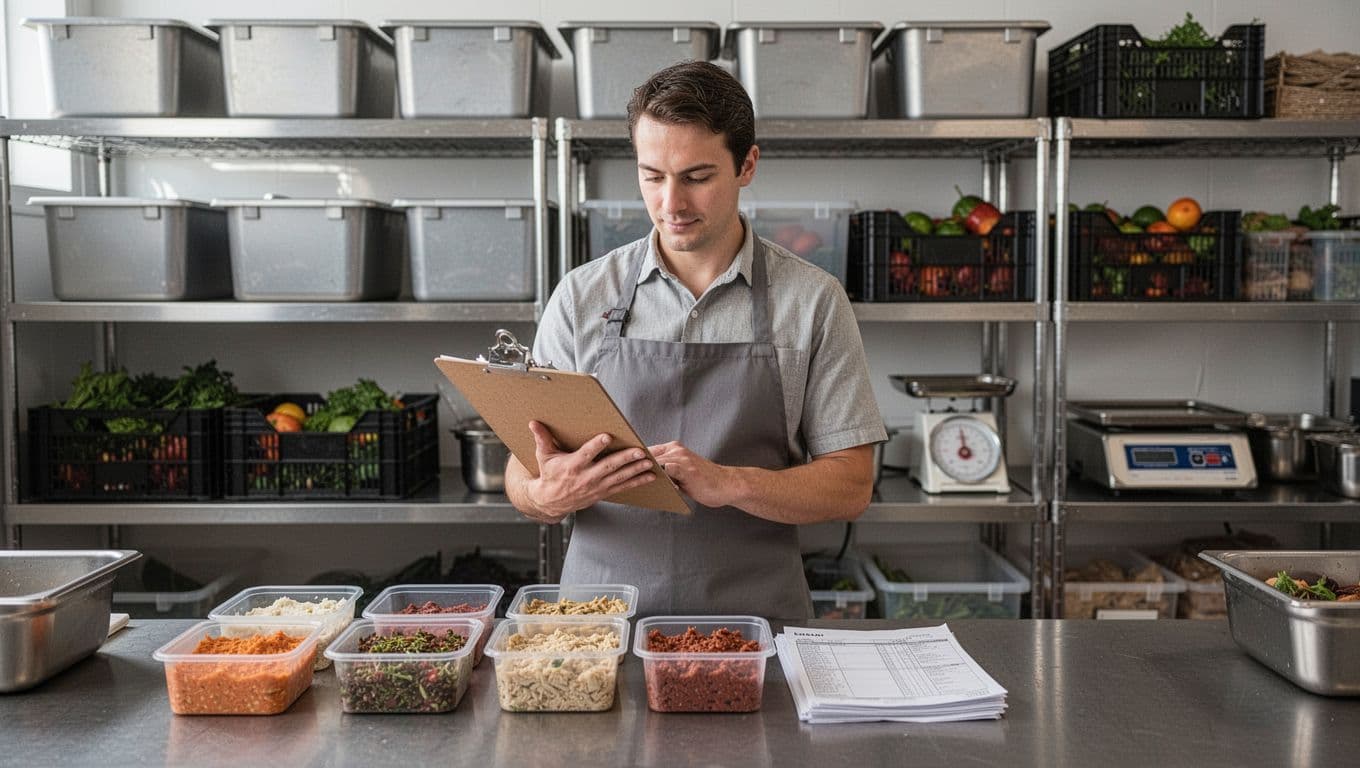
Count the same items in the same units each time. For example, count chicken by pounds, canned tomatoes by cases or cans, and bottled drinks by individual units.
A reconciliation sheet should include:
- Count date and location
- Item name or internal item number
- Storage area
- Unit of measure
- Beginning quantity
- Purchases received
- Transfers, returns, or credits
- Sales usage based on recipes or portions
- Documented waste
- Expected ending quantity
- Physical count quantity
- Unit cost
- Variance quantity
- Variance dollar value
- Counter and reviewer initials
- Notes about damaged, expired, or unusual stock
For clean books, save the count sheet with vendor invoices, receiving records, waste logs, and adjustment approvals. Inventory and COGS recordkeeping becomes easier when those documents stay together by accounting period.
Calculate Expected Usage and Shrinkage
A restaurant needs both a financial calculation and an operating calculation. The financial calculation shows total COGS. The operating calculation helps identify where inventory disappeared.
Use this item-level formula:
Expected ending quantity = beginning quantity + receipts - sales usage - documented waste - other authorized adjustments
Then calculate the physical variance:
Shrinkage quantity = expected ending quantity - physical count quantity
Finally:
Shrinkage cost = shrinkage quantity x unit cost
Worked example with chicken inventory
Suppose a restaurant starts the week with 120 pounds of chicken. It receives 300 pounds during the week. Recipe usage from recorded sales equals 380 pounds, and the waste log shows 8 pounds discarded.
Expected ending quantity:
120 + 300 - 380 - 8 = 32 pounds
The physical count finds 26 pounds. The unexplained variance is:
32 - 26 = 6 pounds
If the recorded cost is $4.50 per pound:
6 x $4.50 = $27 of unexplained shrinkage
The $8 of logged waste is known waste. The $27 is an inventory variance that requires review.
At month-end, the restaurant might also calculate total COGS:
- Beginning inventory: $18,000
- Purchases: $42,000
- Ending inventory: $16,500
- COGS: $43,500
If food sales were $120,000, the food cost percentage was 36.25%. The owner can compare that result with prior months, menu targets, and vendor price changes.
Read the result in context
A single variance doesn't prove a pattern. Compare the dollar amount and percentage with prior periods. A $27 chicken variance may be less urgent than a repeated 2% shortfall across high-value seafood.
Check whether recipe usage is current. If a menu portion changed from 6 ounces to 7 ounces but the recipe still shows 6 ounces, the books may report shrinkage even when the kitchen followed the new portion.
Also check unit conversions. A case-to-pound error can create a large accounting variance without any missing food.
Follow a Daily, Weekly, and Month-End Workflow
A repeatable schedule keeps small errors from becoming a year-end cleanup project.
Daily: capture activity before records go cold
At the end of each shift, the manager should review waste entries, receiving documents, transfers, returns, and unusual voids or comps. Match quantities to the unit used in the inventory sheet.
Next, record any approved staff meals, donations, spoilage, or damaged goods. The purpose is not to blame employees. It is to record what happened while the facts are easy to verify.
A daily review should also compare delivery quantities with vendor invoices. If the invoice says 10 cases and the kitchen received 9, document the shortage before approving payment.
Weekly: count high-risk ingredients
Count expensive or fast-moving items at least weekly. These may include steaks, seafood, liquor, cooking oil, chicken, and specialty ingredients.
Use the same count time, preferably before a delivery or after a defined closing period. Compare the count with sales usage, purchases, and logged waste. Investigate repeated differences rather than reacting to one unusual week.
Review food cost percentage by week when sales volume supports it. Large catering orders, holidays, and promotions can distort a short period, so add an explanation to the records.
Month-end: close the books and post approved adjustments
At month-end, complete a physical count of all material inventory. Reconcile the count to purchases, sales usage, waste, transfers, returns, and credits.
Then calculate ending inventory and COGS. Post only reviewed adjustments, with a short note that identifies the cause or the reason the cause remains unknown.
Match the POS sales reports to deposits and payment processor settlements. A monthly bookkeeping close checklist can help keep inventory review alongside other close tasks rather than treating it as a separate year-end exercise.
Investigate Variances Without Assuming Theft
A variance is a starting point for questions, not a finding of misconduct. Begin with process records and physical facts.
Trace ordinary causes first
Review receiving sheets, invoices, vendor credits, transfer records, and waste entries. Then check whether staff used the correct recipe, portion size, unit of measure, and storage location.
Common causes include:
- A delivery was entered before the full order arrived.
- A vendor shorted an item and issued a credit later.
- Food moved between locations without a transfer entry.
- A prep batch was thrown away without a waste log.
- A recipe or portion size changed.
- An item was counted twice or stored under two names.
- Product was used for a catered event, staff meal, or promotion.
- Inventory was counted at different times relative to receiving and sales.
Review access records and camera footage only when the operational checks don't explain a repeated, material variance. Apply the same process to every shift and employee.
Document the conclusion
Record the item, amount, period, evidence reviewed, conclusion, and accounting action. If the cause is still unknown, say so. A documented "unexplained inventory adjustment" is more useful than a silent change to ending inventory.
Set an internal review threshold based on cost and risk. For example, managers might review any variance above $50, 5% of an item's expected usage, or a repeated difference across two counts. The threshold should focus attention without turning minor count errors into unnecessary conflict.
For account structure, a restaurant COGS chart of accounts can separate food purchases, waste, inventory adjustments, packaging, and operating expenses.
Keep the Records Useful for Tax and Accounting
Your books should show how inventory figures were calculated, not only the final adjustment. Keep invoices, receiving reports, count sheets, waste logs, POS reports, recipe costing records, and adjustment approvals.
The IRS provides general recordkeeping guidance in Publication 583. Tax and accounting treatment may vary by business structure, accounting method, inventory policy, and the nature of the food operation. Have a qualified accountant review how your restaurant records waste, shrinkage, inventory, and COGS before changing account classifications.
A consistent chart of accounts also helps separate management reporting from tax reporting. You can track waste and shrinkage in detail while still presenting the financial statements according to your accountant's policy.
Conclusion
Restaurant inventory shrinkage becomes manageable when the books distinguish known waste from unexplained differences. Record waste during each shift, count important items on a fixed schedule, calculate expected usage, and investigate variances through invoices, recipes, transfers, and count procedures.
The strongest system doesn't assume theft or ignore losses. It creates a clear record of what the restaurant bought, sold, discarded, counted, and adjusted. That record gives owners better cost information and gives their accountant support for accurate financial statements and tax work.